Customer receivables
Menu › Reports › Receivables Report
What question it answers
“How healthy are my receivables?” Not just how much customers owe, but since when — which is what tells you whether the debt is going to get collected or not.
How to read it
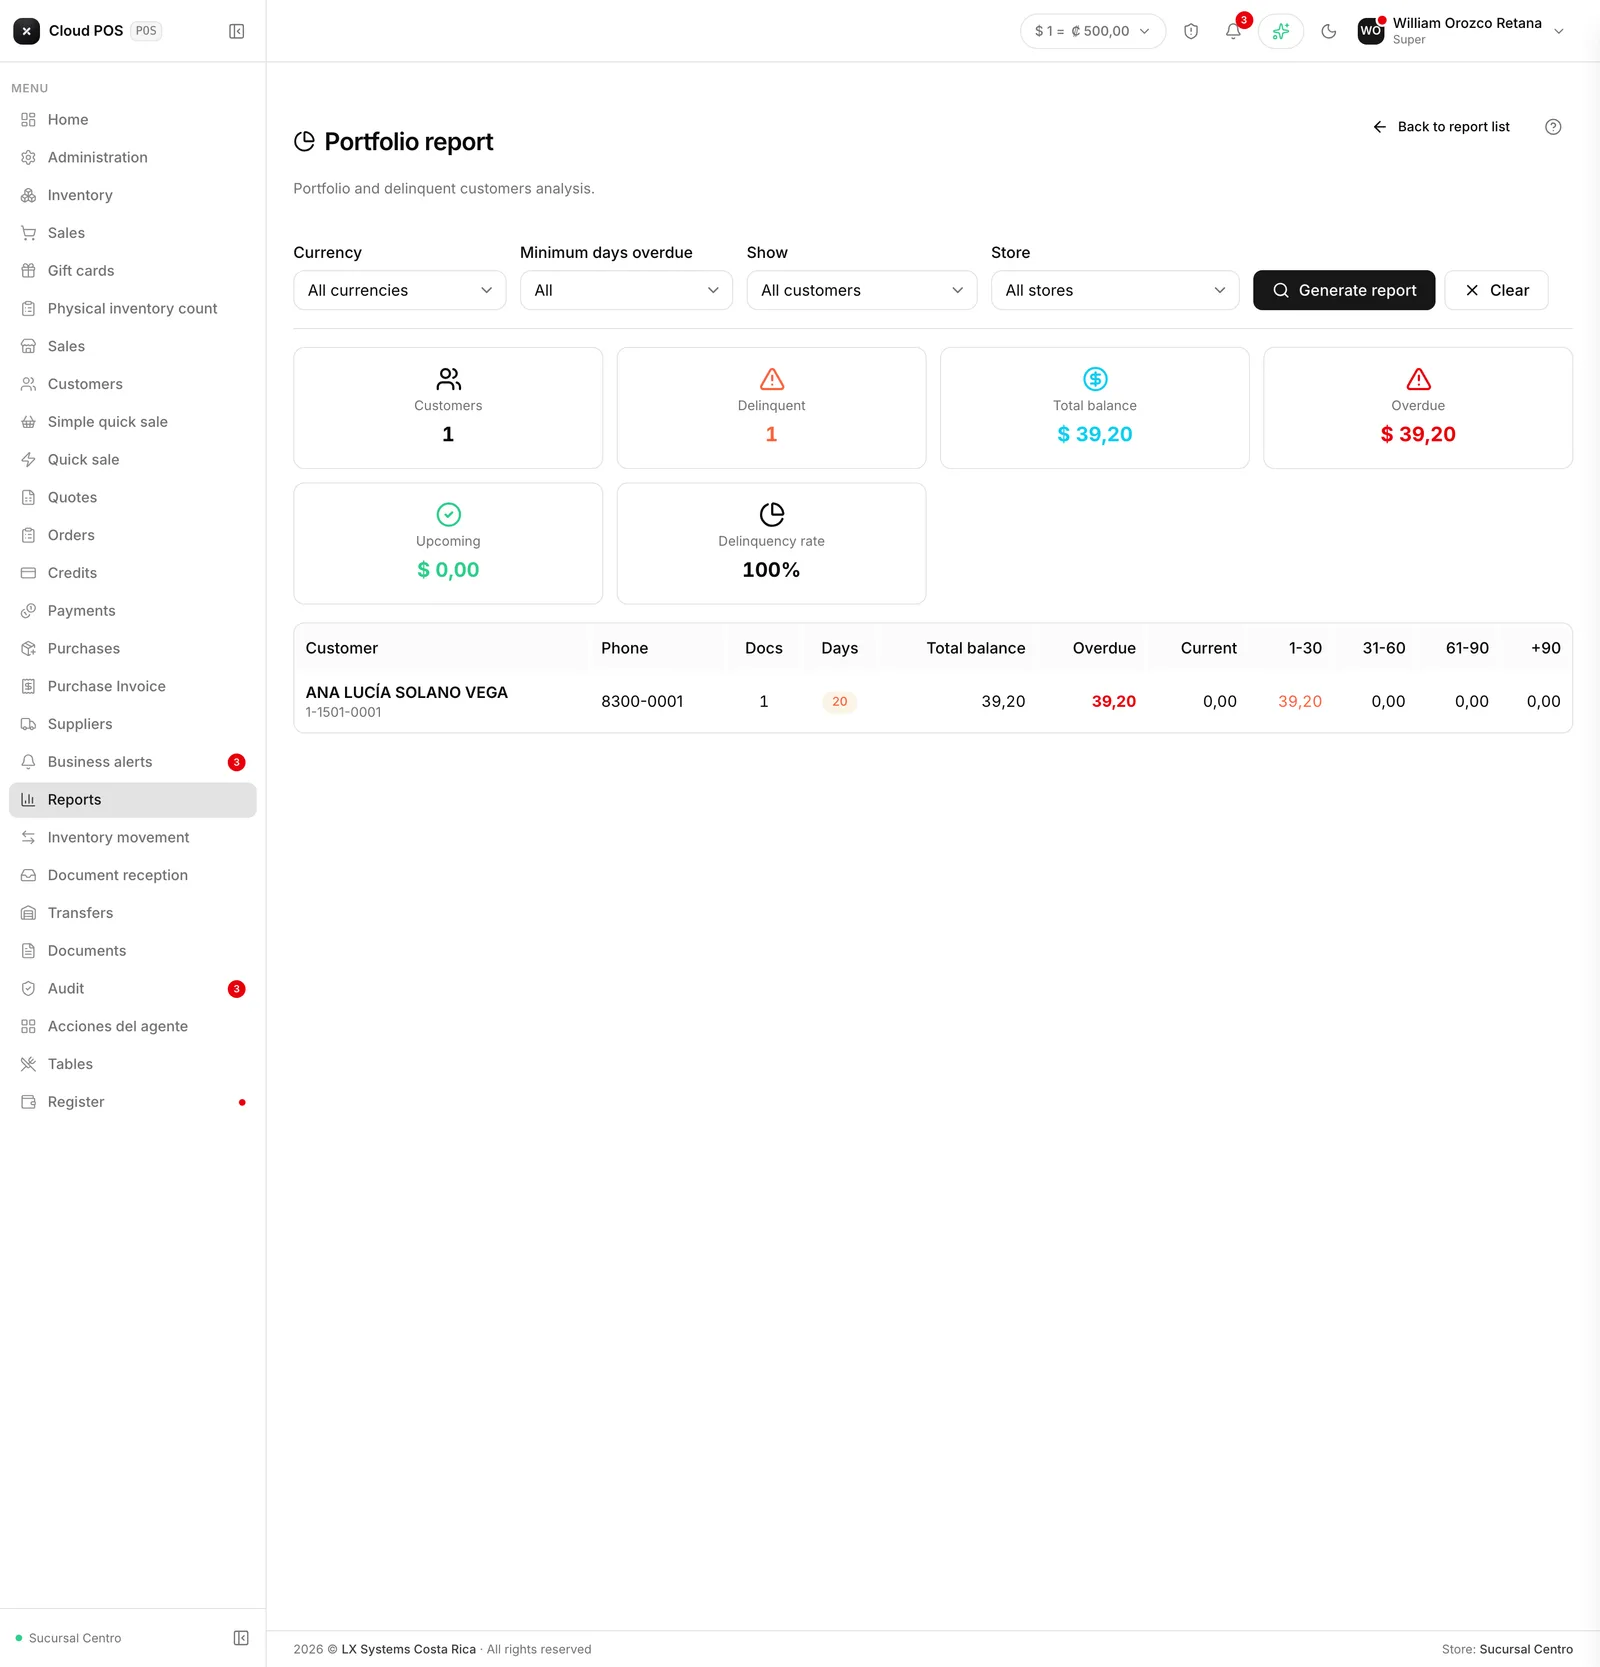
The indicators at the top give the overview: how many customers, how many are delinquent, how much is overdue, how much is coming due, and the delinquency percentage.
The table splits each customer’s debt into columns by age: current, 1 to 30 days, 31 to 60, 61 to 90, and over 90. Overdue amounts are highlighted.
Look at the columns on the right first. What’s in the +90 column is what will probably never get collected.
The filters
You can narrow it down by currency, by minimum days overdue, by point of sale — if the business has more than one — and show only customers with an overdue balance. That last filter turns the report into a list of delinquent accounts.
Good to know
The delinquency percentage is the number to watch over time. One number on its own doesn’t say much; three months of it climbing says a lot.
It loads as soon as you open it, without asking for dates: it’s a snapshot of today.
This report doesn’t export to Excel. If you need the list in a spreadsheet, use Accounts receivable or Overdue accounts.