The business explained in words, and easier inventory counts
Version from Sunday, May 31, 2026This month’s improvements are on the side of reports and inventory counts.
The business explained in words, not in tables
There’s a new report that doesn’t hand you numbers and leave you to draw the conclusion: it hands you the conclusion, written out. Choose a date range, and in a few seconds you get a summary of how sales, receivables, and inventory are doing, with what’s worth a closer look.
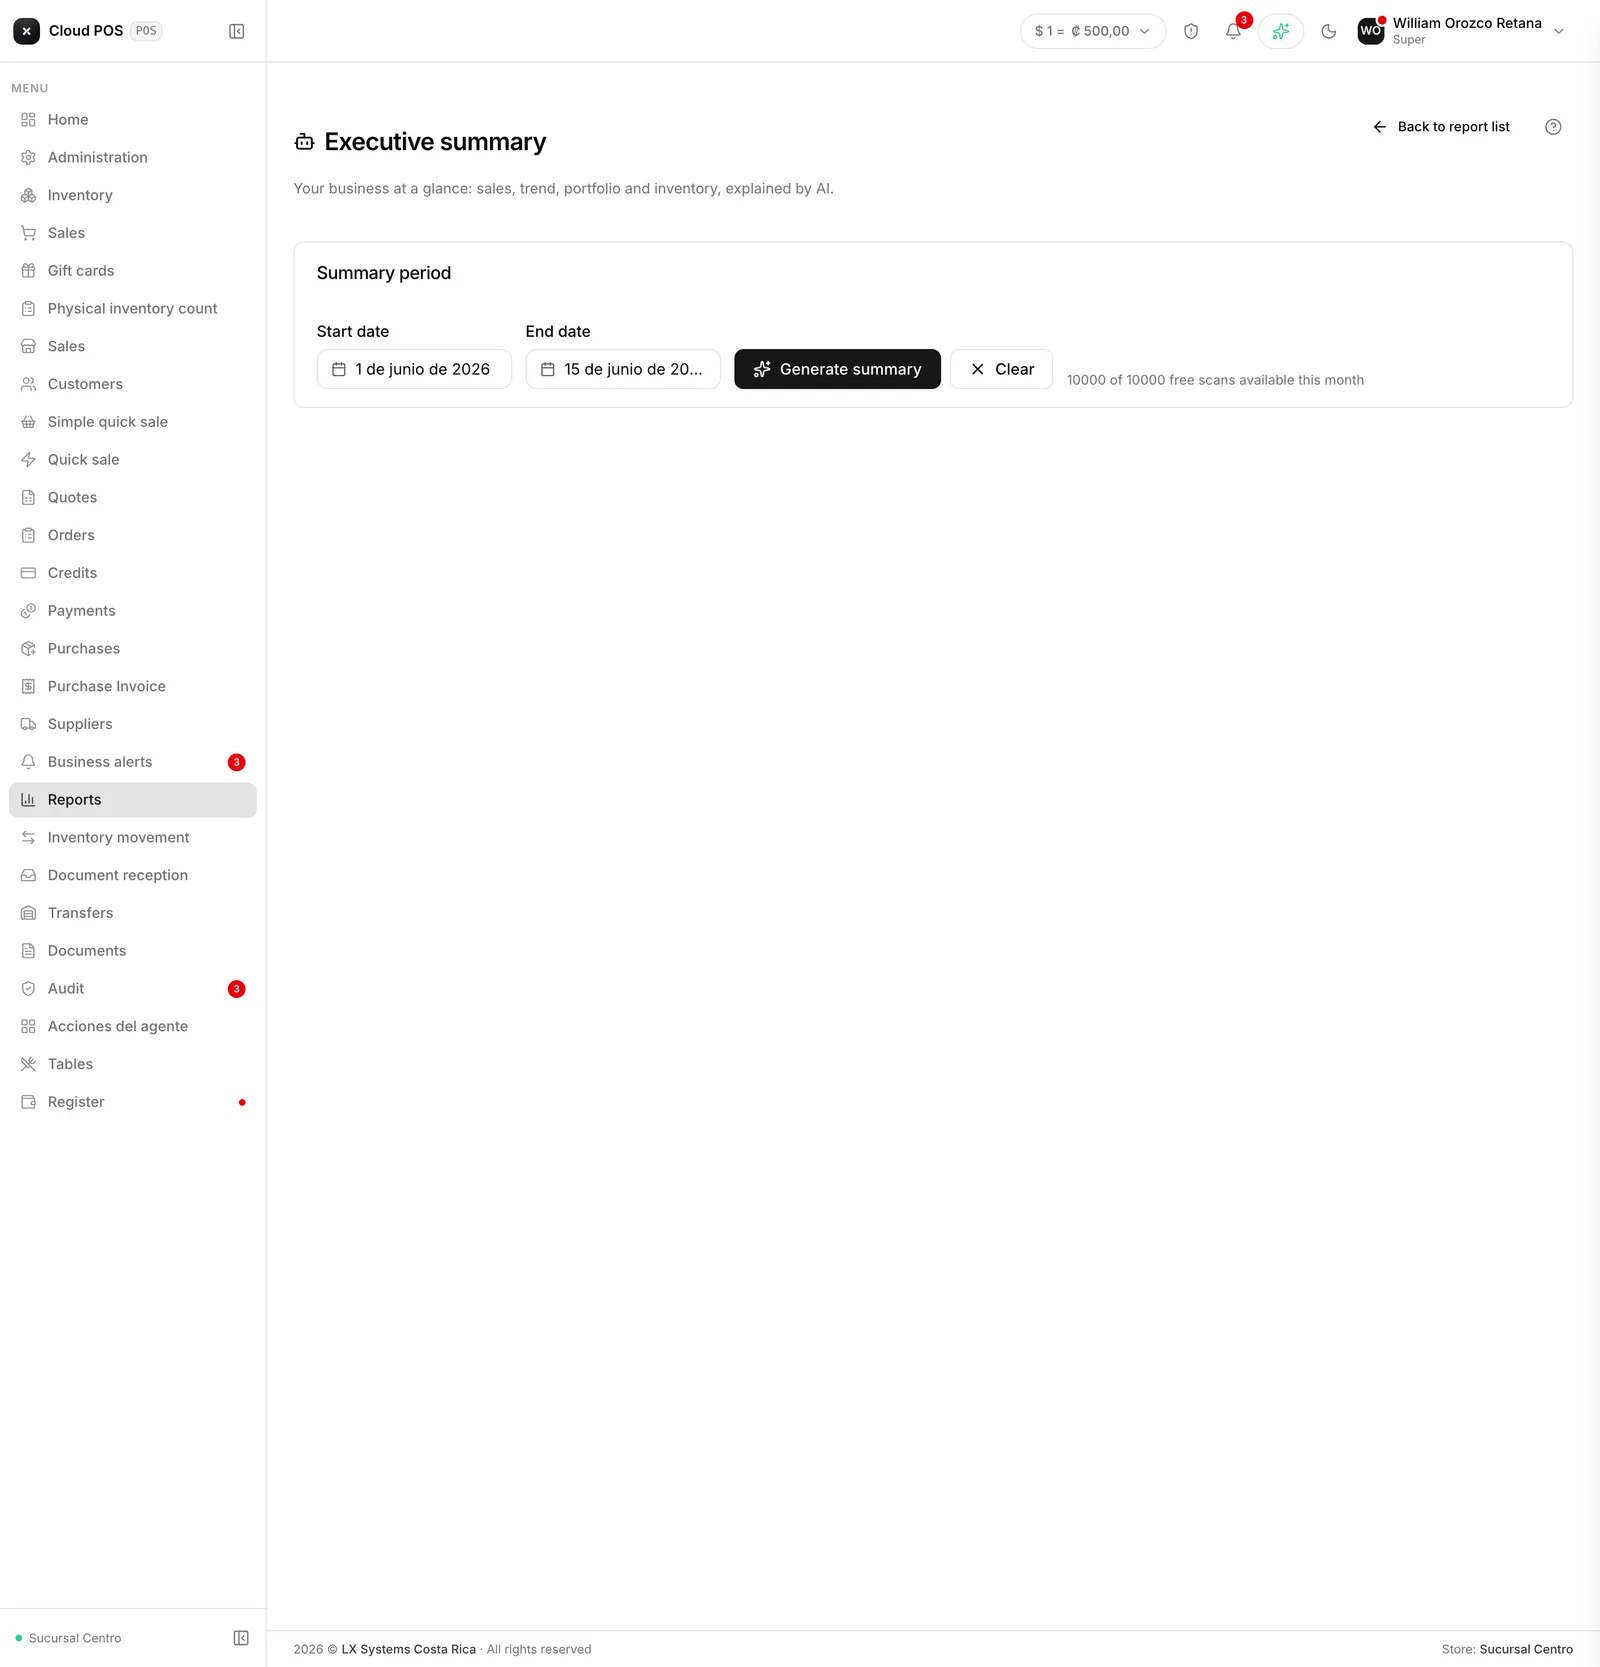
You get a quota of free analyses each month. If you ask for the same period again, the answer comes from what was already generated and doesn’t use up your quota.
How to use the executive summary →
Physical inventory counts
Counting inventory by hand now has its own workflow, with automatic saving as you enter numbers: if you get interrupted halfway through the count, you pick up where you left off instead of starting over.
The Transactions report now shows indicators
When you open the Transactions report you now see, at a glance, the total collected, the number of transactions, and the average ticket, without having to add them up yourself. Filtering by a specific cashier is also faster now when you start from “all users.”
Faster product searches
Searching for a product — when selling, when receiving stock, when checking inventory — responds faster on every screen that uses it, because they now share the same search instead of each one having its own.
Don’t see one of these features? The AI-powered executive summary is turned on per business. Write to us and we’ll enable it for you.